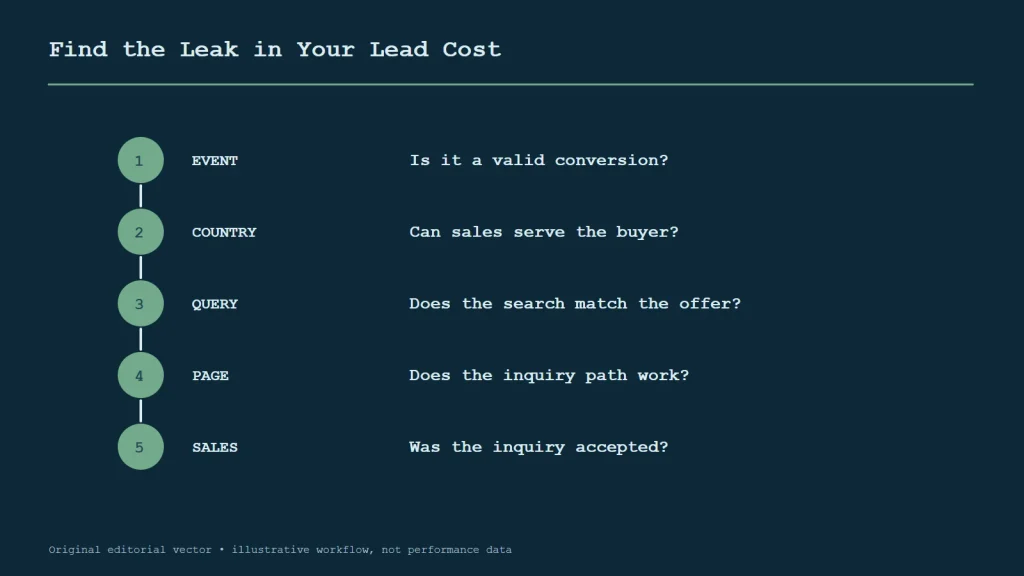
Understanding how to reduce cost per lead in international Google Ads requires finding where the cost is coming from. Check the conversion definition first, then separate countries, queries, pages, and sales outcomes. A bid change cannot repair a broken form or make an unserviceable country profitable. Use this diagnostic sequence to find the cause and judge the fix by both platform CPL and the cost of sales-accepted inquiries.
Follow the diagnosis
- Treat a rising CPL as a symptom, not a diagnosis
- Step one: verify the conversion before changing the campaign
- Step two: isolate countries, languages, and serviceability
- Step three: inspect search terms for intent leakage
- A spending spike and a lead-cost problem are different findings
- Step four: check budget, bidding, and auction constraints
- Step five: audit landing pages and inquiry friction
- Step six: bring sales follow-up into the cost model
- Step seven: use one-variable tests and document the result
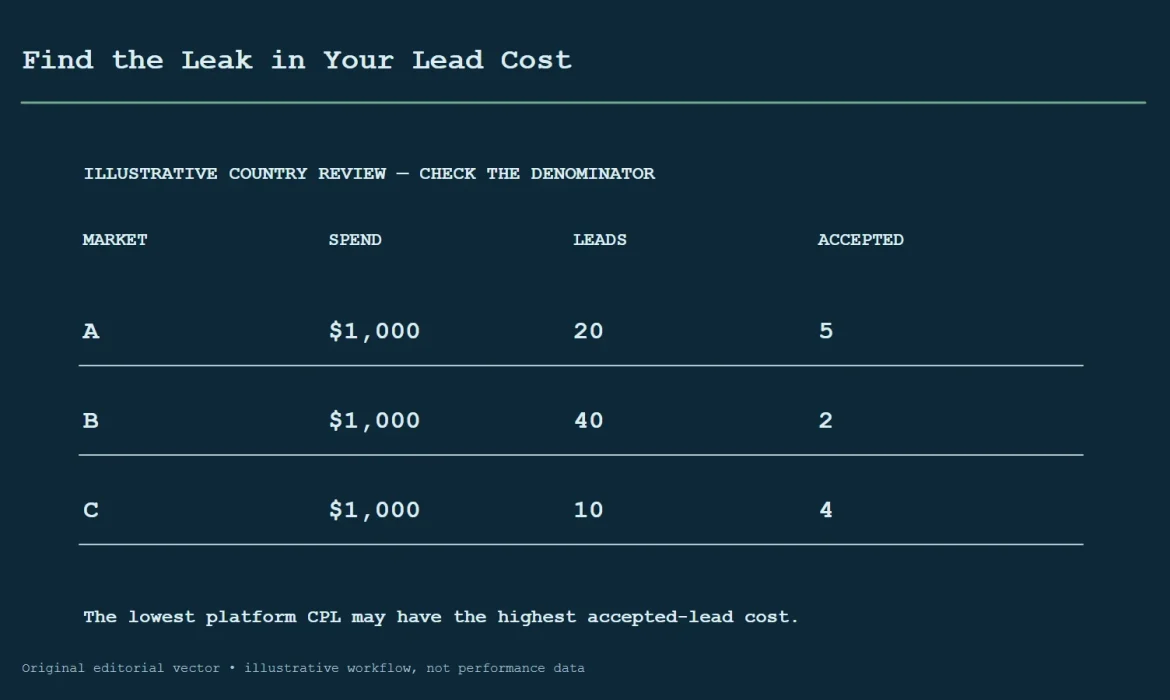
- A diagnostic example: one global number, three different problems
- How to reduce international Google Ads CPL: audit sequence
- How to reduce cost per lead in international Google Ads: check account history
- Decide whether the fix belongs in media, the website, or sales operations
- Make an international CPL dashboard useful to leadership
- Two decisions worth resolving early
- CPL troubleshooting questions
- Lower the cost that matters to the business
Treat a rising CPL as a symptom, not a diagnosis
Cost per lead is spend divided by the number of leads under a stated definition. If that definition changed, the metric may move even when the market did not. A team may have switched from counting quote requests to counting all form submissions, changed an attribution window, or repaired a previously broken event. Before declaring that cost is rising, write down the numerator, denominator, currency, time zone, reporting period, and data source. Compare like with like.
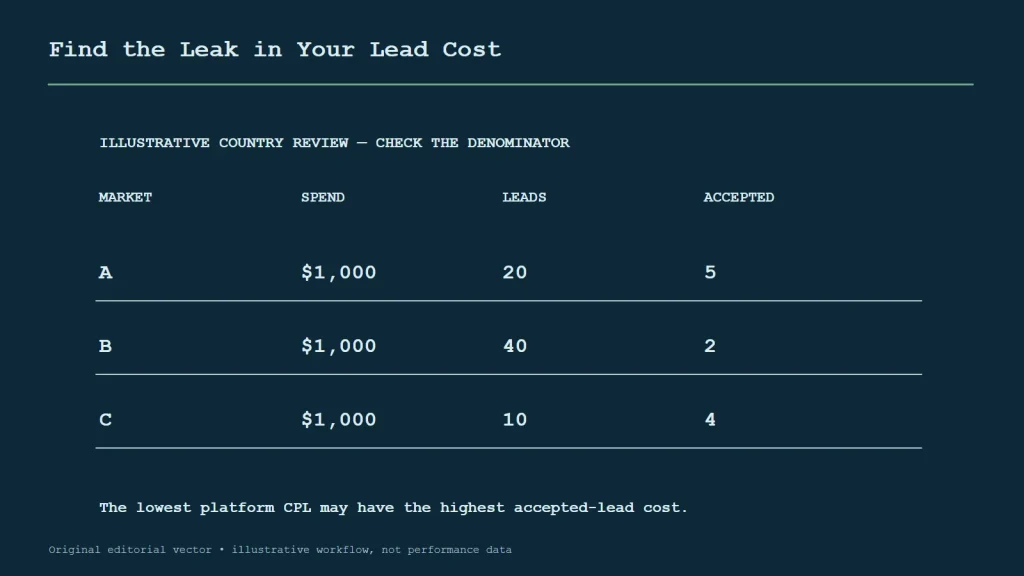
International campaigns add more dimensions to the diagnosis. One country may have higher competition; another may have a weak translation; a third may receive traffic the company cannot serve. A pooled account average hides these differences. Start with a country table that shows media cost, platform leads, sales-accepted leads, invalid or duplicate leads, response time, and sales stage. If the CRM data is delayed, show the number of records still pending rather than counting them as rejected or accepted prematurely.
Define which business outcome you are trying to make less expensive. Platform CPL can help monitor campaign delivery. Cost per contactable inquiry helps evaluate data quality. Cost per sales-accepted lead connects marketing to sales fit. Cost per quote or opportunity captures later progress. Each has a different denominator and maturation time. A report should not label all of them “CPL” without a qualifier. If the business only has platform conversions, say that sales quality is unknown and make the feedback loop a priority.
Step one: verify the conversion before changing the campaign
Start with a test submission from the destination page. Confirm that the form works, that the thank-you state appears, that the analytics event fires once, and that the record reaches the CRM. Then compare the same journey in Google Ads, Analytics, and the business system. An event can be configured correctly but still count a button click rather than a completed request. A duplicate event can inflate the denominator and make reported CPL appear lower than reality.
Review the conversion action’s purpose, status, attribution setting, counting method, and primary or secondary role in the account. The exact controls depend on current product behavior, so check Google’s official documentation and the live interface. Keep one primary action aligned with the campaign goal. Retain useful micro-actions for analysis if needed, but do not let downloads, page views, and quote requests become interchangeable optimization signals by accident.
Check for changes in measurement history. Did the site deploy a new form? Did a consent banner change? Did a domain redirect or language path break? Did the CRM import arrive late? Did the company redefine a lead stage? Annotate those dates on the performance report. If tracking failed during one period, do not use its CPL as a clean baseline. Repair and validate the data before deciding that bids, keywords, or agencies caused the change.
Step two: isolate countries, languages, and serviceability
Build a country-level view before comparing totals. Include currency conversion rules and market-specific business context. A country with expensive clicks may still produce profitable opportunities, while a low-cost market may yield unserviceable requests. Review product availability, delivery range, sales representation, time zone coverage, and any restrictions that apply. Marketing should coordinate with sales, operations, and qualified compliance staff rather than making those decisions from ad data alone.
Check how location targeting is configured. The account may target people physically present in a location, people interested in a location, or another current option. Confirm that the setting matches the business’s intended reach and the current platform definitions. Then inspect actual geographic reports to see where impressions and leads came from. Avoid assuming that the campaign’s country label proves every viewer or inquiry was within the intended market.
Language deserves its own review. Ads, keywords, pages, forms, and sales follow-up should use language the intended buyer understands. Literal translation can mismatch local product terms or procurement expressions. Have a fluent market reviewer check the query vocabulary and page, especially for technical products. If the company cannot respond in a language it advertises, make that limitation visible and decide whether the campaign should be narrowed or paired with a qualified local team.
| Market signal | What to compare | Possible next action |
|---|---|---|
| High click cost, strong acceptance | Margin and opportunity value | Hold or test additional eligible queries |
| Low CPL, low acceptance | Query intent and form criteria | Review traffic and qualification |
| Many out-of-market inquiries | Location settings and exclusions | Correct reach and service regions |
| Slow response in one region | Time zone and sales ownership | Assign coverage before scaling |
| Language mismatch | Search terms, copy, page, follow-up | Localize with a fluent reviewer |
Step three: inspect search terms for intent leakage
Search terms reveal what people actually typed, which can differ from the keyword the advertiser chose. Review them by country and campaign goal. Look for student research, jobs, consumer repairs, free samples, used goods, unrelated meanings, and regions the business does not support. The categories depend on the product. Write a reason beside each exclusion so another operator can understand why it was added and whether it should apply to another product line.
Use negative keywords carefully. Their behavior can differ from positive keyword matching, and a broad exclusion can block a legitimate industrial query. A word such as “cheap” may indicate low purchase intent for one business but price-focused sourcing for another. Check Google’s current matching documentation, then inspect a sample of actual queries before adding a shared negative list. If a term has both relevant and irrelevant uses, refine the ad group or page rather than excluding it blindly.
Separate the roles of product, application, supplier, and research queries. A manufacturer may want a specification-focused page for technical research but a direct RFQ for supplier intent. If the same ad and page serve every term, the form rate may be low because the page asks too early or answers the wrong question. Create a query map that links each intent to an ad message, destination, and conversion. This creates a better diagnostic than simply raising bids on the keywords that already have volume.
A spending spike and a lead-cost problem are different findings
Before diagnosing a high-cost day, check whether the account behaved as the platform documentation allows. Google’s budget guidance says a campaign may spend up to twice its average daily budget on a given day, with the standard monthly limit calculated using 30.4 times the average daily budget. Budget changes and campaign-specific rules must be checked separately. A single day’s spend above the average setting is therefore not, by itself, evidence of a fault.
Lead cost still needs investigation. Imagine a $100 average daily budget and a $200 day. If one valid inquiry arrives, that day’s observed CPL is $200. If no inquiry arrives, dividing by zero produces no useful CPL value; show the spend and zero leads rather than inventing a cost. Then inspect a longer, consistent review window and the relevant country cohort.
This is where a diagnostic report should resist drama. One unusually expensive day may reflect delivery timing. Several weeks of irrelevant queries suggest a different issue. A broken submission path requires immediate repair even if the spending pattern looks normal. Write down which observation supports the diagnosis and which evidence would disprove it. That habit keeps the team from lowering bids to solve a form error, or rebuilding an account because a daily average was mistaken for a daily spending ceiling.
Step four: check budget, bidding, and auction constraints
Once measurement and traffic are understood, inspect the budget and bidding setup. A campaign may be limited by budget, may be learning from too few meaningful events, or may be spending on low-value searches. These conditions call for different responses. A budget increase can help capture more eligible demand but does not guarantee lower CPL. A lower bid can reduce reach or change which auctions the campaign enters. Before editing, write down the expected effect and the review signal.
Google’s published guidance on average daily budgets describes possible daily overdelivery and a monthly spending limit calculated from that average daily budget. For eligible campaigns, the help documentation explains that spend on a given day can reach up to twice the average daily budget while the applicable monthly limit remains bounded by the documented multiplier. Check the live Google Ads Help page and account terms before using this rule in a forecast; it is a billing rule, not a promise about lead volume or efficiency. Finance should approve the planned monthly exposure.
Use the business’s acceptable cost and sales economics to make a budget plan. If a sales-accepted lead produces different opportunity values by country, one global target may be misleading. Set targets with a clear time frame and margin logic. Do not switch bid strategies simply because a short period looks weak. First confirm that the campaign has enough valid, consistently measured events for the strategy to learn from. If volume is limited, manual review and tightly scoped tests may be more informative than repeated automation changes.
Step five: audit landing pages and inquiry friction
Open the destination in the same country, language, and device context as the ad. Confirm that the page loads, the product is available, and the headline corresponds to the query. A visitor searching for a specific component should not have to search the entire website to find its dimensions or application. Provide the evidence needed to take the next step: specifications, use cases, relevant certifications where verified, company identity, shipment or quote process, and a clear inquiry route.
Review the form from the buyer’s perspective. Is every required field necessary? Are fields labeled in the language the user expects? Does the form state what will happen after submission? If the lead needs a technical review, explain the handoff. A very short form can create more follow-up work if sales must ask basic questions; a long form can discourage an otherwise useful inquiry. Test a focused change rather than rewriting the entire page, and track both submission and accepted-lead rates.
Test mobile and desktop layouts, redirects, page speed, validation messages, and confirmation behavior. Check whether the page changes by region or language and whether every variant has the correct form routing. A site update can break a form without changing the ad account. Keep a simple page QA record with the URL, test date, device, fields, event, and CRM destination. If a page is inaccessible or technically unreliable, pause or redirect the campaign through an approved process until it is fixed.
Step six: bring sales follow-up into the cost model
A lead cost can rise because the campaign’s conversion rate falls, but business value can also deteriorate after the submission. Review first-response time and assignment coverage by country. Identify whether inquiries are contacted, whether they respond, and whether the conversation reaches a quote. The sales team may reveal that a particular market needs a local-language reply or that a product page attracts the wrong specification. Feed those insights back to the campaign owner with examples that do not expose unnecessary personal data.
Use a short set of CRM rejection reasons. Possible labels include wrong market, wrong product, consumer inquiry, missing contact details, duplicate, student or job seeker, no current project, and not yet reviewed. Tailor the list to the business and keep it manageable. If every salesperson uses a different note, the marketing team cannot aggregate feedback. Provide examples and revisit the definitions during the first month of implementation.
Calculate cost at more than one stage. For example, if an account spends $12,000 in a month and generates 120 platform conversions, platform CPL is $100. If only 30 records meet the agreed sales-accepted definition, cost per accepted lead is $400. These are hypothetical numbers used to show the calculation, not a benchmark. If 10 of the 30 accepted records proceed to a quote, cost per quote is $1,200. These later measures take time, but they help the business decide whether a lower top-of-funnel CPL is actually useful.
Step seven: use one-variable tests and document the result
After the audit, prioritize the cause with the strongest evidence. If irrelevant searches dominate, address query controls. If the form fails, repair the path. If one market has no sales owner, fix coverage. If the ad and page do not match, align the message. Changing all of these simultaneously can make the next report uninterpretable. Use a test log that records the hypothesis, specific change, date, affected market, expected result, and review point.
Choose a test period that reflects actual search and sales volume. A niche manufacturer may need longer than a high-volume ecommerce category. Do not stop a test just because one day is expensive, and do not keep a failing setup indefinitely because the platform is still learning. Agree on a reasonable evidence threshold in advance. If the sample is too small, state that and decide whether to extend, combine only comparable data, or stop because the opportunity does not justify more spend.
Preserve versions of ads and pages. If a new translation, offer, or product page replaces the old one, retain the old asset and date. This is especially important across international markets, where one country may change before another. A version record lets a reviewer connect performance with what was actually live. It also helps avoid repeating a test that already showed a clear mismatch.
A diagnostic example: one global number, three different problems
Imagine a fictional exporter running campaigns in three countries. The blended platform CPL rises from $95 to $125 over two review periods. A top-line report might suggest that the account is deteriorating everywhere. Country segmentation shows a different picture: Country A has stable accepted-lead cost, Country B has increased consumer searches, and Country C has fewer submissions because the local form began routing to a retired inbox. These are three operational problems with three different remedies.
The team first repairs Country C’s route and tests the CRM record. It reviews Country B’s search terms and confirms that several consumer-intent queries should not be part of the B2B campaign. Country A is left unchanged while the sales cycle matures. The next report includes both platform CPL and cost per sales-accepted lead, with pending records shown separately. This example is hypothetical; it illustrates why an international total should not be used as a diagnosis.
If the overall number later improves, the team should still not claim that a single change caused the result unless the comparison supports that conclusion. It can say that after a routing repair and query review, the observed indicators moved in a particular direction over a stated period. The strength of the conclusion should match the design. Good campaign reporting describes what was changed and what was observed without inventing certainty.
How to reduce international Google Ads CPL: audit sequence
- Write the current CPL formula, currency, period, and conversion definition.
- Test the ad-to-page-to-form-to-CRM path and verify deduplication.
- Compare spend, lead quality, serviceability, and response time by country.
- Review search terms and match behavior for irrelevant intent.
- Check location, language, device, and destination-page alignment.
- Inspect the budget and bid strategy against the available valid conversion data.
- Fix the single most evidenced cause and record the change date.
- Reassess both platform CPL and sales-accepted-lead cost after a suitable window.
How to reduce cost per lead in international Google Ads: check account history
Performance comparisons can be distorted by account changes that have nothing to do with the product’s underlying demand. Look at the timeline for new campaigns, budget edits, match-type changes, landing-page releases, consent-banner updates, conversion imports, and sales-process changes. A cost increase may follow a launch into a broader audience or a change in how the platform counts a lead. Annotate known events before comparing month over month. If multiple changes happened on the same date, say that the cause cannot be isolated from the available record.
Review seasonality and commercial operations with the people closest to the market. A holiday, trade show, inventory shortage, shipping interruption, competitor change, or distributor agreement can change what buyers do and what the business can deliver. The ads operator may not see these factors in the interface. Ask sales and operations for a short market note alongside the campaign data. This does not replace measurement; it provides context for interpreting an observed change. Keep the note dated and distinguish a verified event from a hypothesis.
When the account is new, create a baseline period with stable definitions before making multiple changes. Preserve the search-term report, settings, and landing-page version. If a prior agency did not document work, the first task may be to rebuild that history from available exports and invoices. Mark the reconstructed baseline as incomplete. It is better to begin with a qualified starting point than to tell leadership that a new team caused improvement or decline without enough evidence.
Decide whether the fix belongs in media, the website, or sales operations
A high CPL can originate in different parts of the system. A query mismatch is a media issue. A page that fails to explain the product is a web-content issue. A form that submits but loses data is a technical issue. A valid lead that waits days for a reply is a sales-operations issue. The campaign manager should identify the probable owner and show the evidence. Sending every problem to the media buyer can create repeated bid changes that do not address the actual bottleneck.
Create a simple issue log with symptom, evidence, owner, planned action, and review date. For example, “Country C has 14 inquiries, 9 outside the service region; sales and marketing will review location settings and form copy by Friday.” That is more actionable than “quality is poor.” The log also helps leadership see dependencies that may require development time or local expertise. If no one owns a fix, record that as a risk rather than silently waiting for the next report.
When the source is uncertain, choose a low-risk diagnostic. Re-test the form, review a sample of search terms, inspect a page on mobile, or compare CRM fields before making a large budget change. If the diagnostic confirms the problem, then implement a targeted fix. If it does not, return to the issue tree and test the next plausible cause. This method is slower than changing several settings at once, but it produces reusable knowledge and makes it easier to avoid repeating the same ineffective adjustment.
Make an international CPL dashboard useful to leadership
A leadership view should show the small set of measures that supports a decision. Include the time period, country, spend, platform conversions, accepted leads, pending leads, cost per accepted lead where available, and the next action. Add a note about currency and attribution. Do not place every diagnostic metric on the first screen. Keep a detailed tab for search terms, device, language, pages, and lead dispositions so an analyst can explain a movement when it occurs.
Use consistent labels. “Platform lead,” “contactable inquiry,” “sales accepted,” “quote,” and “opportunity” should not be abbreviated into the same column. Show the count and denominator for each rate. If 8 of 20 leads are accepted, the report should say 8/20, not just 40%, so a reader sees the sample size. A small percentage based on a handful of inquiries can move sharply from one month to the next. The denominator keeps the scale visible.
End the report with a decision request. Leadership may need to approve a market pause, a page change, an additional test period, or a tracking repair. Name the person who will do the work and when the decision will be reviewed. If the numbers do not yet support an action, state what additional evidence is needed. A report that makes uncertainty legible can still be decisive about the next step.
Two decisions worth resolving early
Does a Google Ads daily budget cap guarantee monthly lead volume?
No. Google documents budget and overdelivery rules, not a guaranteed number or cost of leads. Budget limits control spend exposure under the applicable terms; auction demand and conversion behavior remain variable.
What if my CRM data is incomplete?
Label sales quality as unknown, repair the assignment and status process, and use platform data only for the questions it can answer. Do not present unverified form submissions as accepted opportunities.
CPL troubleshooting questions
What is a good international Google Ads cost per lead?
There is no universal target. Costs vary by product, country, competition, sales cycle, margin, and lead definition. Calculate cost per sales-accepted lead and compare it with the business’s economics rather than relying on an unsourced global average.
Why did my cost per lead rise suddenly?
Possible causes include tracking changes, more expensive auctions, search-term mix, country mix, page or form problems, reduced response coverage, or a change in how leads are counted. Compare those dimensions before changing bids.
Should I lower bids to reduce CPL?
Not automatically. Lower bids may reduce cost but also limit reach or alter auction participation. First determine whether the cost increase is caused by irrelevant traffic, measurement, conversion rate, or downstream quality.
How often should international search terms be reviewed?
Set a cadence that matches spend and account activity, with additional reviews after launch or major changes. Record why terms are excluded and check current matching documentation before applying broad negative rules.
Can I compare CPL across countries?
Only with context. Use consistent conversion definitions and currency rules, and compare accepted-lead quality, margin, fulfillment, and response coverage. A blended average can hide important country differences.
Lower the cost that matters to the business
The most useful cost reduction is not always a lower platform CPL. It is a better relationship between spend, serviceable inquiries, sales attention, and commercial progress. Start with measurement, segment international performance, and repair the strongest evidenced bottleneck. Keep the changes small enough to interpret and share the review with sales. If the evidence is incomplete, say so and make data quality the next task rather than hiding the gap in a blended average.
For help reviewing market and channel structure, see Marketboo’s global paid media service. If the team wants to keep account access in-house while learning a repeatable diagnostic process, explore hands-on advertising coaching.