

Quick answer: This guide explains how to measure social media ROI for ecommerce: define the outcome, include the costs that produced it, and state how credit is assigned. Track platform activity, tagged visits, store events, creator links or codes, and repeat purchases as related but distinct signals. Use contribution or profit where the business can calculate it; do not call gross attributed revenue ROI. Separate platform-reported conversions from analytics and order-system records, account for returns and discounts, and state the attribution window. When the team needs a causal answer, consider a suitable controlled test. If the available data cannot support that conclusion, report the uncertainty rather than filling the gap with a precise-looking percentage.
“Social drove $50,000” sounds clear until the finance team asks whether that number is gross order value, net revenue, attributed sales, or incremental contribution after returns and campaign costs. A credible return report starts by agreeing on those terms before the campaign begins.
How to measure social media ROI for ecommerce before selecting a dashboard
Return on investment is a comparison between a defined return and the resources spent to produce it. Ecommerce teams often use the formula:
ROI = (incremental contribution attributed to the activity − total activity cost) ÷ total activity cost
The formula is only useful when the nouns are defined. “Incremental contribution” should refer to business value above an appropriate baseline, adjusted for the costs or margin relevant to the decision. “Total activity cost” may include media, creator fees, content production, agency time, tools, discounts funded by the company, and staff labor. Some teams instead report attributed revenue divided by ad spend; that is a different ratio often called return on ad spend (ROAS), and it does not account for product costs or all campaign expenses.
Choose the metric that matches the decision. A paid campaign manager may need ROAS for day-to-day optimization. A finance leader may need contribution margin and net profit. A social content team may need a longer view of assisted customer acquisition or repeat purchase. Do not put these measures under one “ROI” label without naming the formula and denominator.
Set the reporting unit too. Are you measuring a post, creator, campaign, platform, customer cohort, or entire social program? Each level answers a different question. A single creator code can help trace orders, while a program-level model may include dozens of assets and repeat customer behavior. Be explicit about dates, market, product range, currency, and whether the number includes organic, paid, or both.
Choose a baseline that fits the campaign
Before calling a result incremental, decide what comparison represents the likely outcome without the campaign. Depending on the question and available volume, a team might use a randomized holdout, a matched geographic comparison, a staggered launch, or a transparent historical baseline. These designs differ in strength and cost. A before-and-after comparison is easy to run but sensitive to seasonality, inventory, pricing, and other simultaneous changes. A holdout can offer stronger evidence when the groups are comparable and the test is designed correctly, but it is not automatically practical for a small audience.
Write the baseline assumption in the brief. For instance, “We compare eligible markets with similar historical order patterns while keeping email promotions unchanged” is more informative than “social delivered a lift.” If important conditions differ, note them. A test that changes creative, discount, audience, and landing page simultaneously may show that the overall package changed performance, but it cannot isolate which component mattered.
Audience context can inform which platforms deserve a measurement test, but not the ROI outcome. Pew Research Center’s 2026 survey reports that 51% of U.S. adults say they ever use Instagram, 31% TikTok, 70% Facebook, and 84% YouTube. It surveyed 5,511 U.S. adults between January 30 and June 18, 2026, with an overall margin of error of ±1.8 percentage points. These are self-reported U.S. adult use figures; they are not ecommerce buyer rates, exposure, sales, or a forecast for a particular store. Use them as broad planning context, then validate with your own market, account, and order data.[8]
Decide how the team will treat cross-channel overlap. An ecommerce customer may see a social video, search for the product later, receive an email, and return through a bookmarked page. A last-click report gives credit to the final recorded touchpoint; another model may distribute credit differently. Neither model reconstructs every influence. The report can show more than one view, as long as it labels each method and avoids summing overlapping credits into a larger sales total.
Make a compact measurement brief with the primary question, metric owner, data source, and planned decision. For example, a team may want to know whether adding creator content improves qualified first orders in one market. The brief should say which orders qualify, how creator exposure will be observed, which costs are included, how returns will be handled, and what evidence would justify continuing. This forces the team to discuss measurement gaps while it can still improve tracking.
Do not use “social ROI” as a single number for every stakeholder. A content editor may need to see whether people save or share an explanation; an ecommerce manager may focus on product views and cart progression; finance may evaluate contribution after costs. These are connected but different questions. A shared report can show them in layers, with a clear note that engagement is an intermediate signal and contribution is a business outcome.
When sample volume is limited, present counts and ranges as well as ratios. A result based on a few orders can change sharply when one order is refunded or one customer makes a repeat purchase. Describe the period and count behind the percentage, and avoid comparing tiny samples to a high-volume platform benchmark that uses different definitions.
Build a cost ledger that reflects the work
Social activity has more costs than media spend. A complete cost view may include creative strategy, filming, editing, photography, translation, moderation, community response, creator compensation, usage rights, platform spend, landing-page work, agency fees, and analytics implementation. Some costs are shared across campaigns. Choose a consistent allocation rule—for instance, assign production to the campaign that commissioned it or spread an evergreen asset’s cost over an agreed useful period—and disclose the method.

Staff time is often omitted because payroll already exists. That can be reasonable for a marginal budget decision if the team has capacity, but it can hide the true cost of scaling. Keep both views when helpful: cash cost and fully loaded operating cost. Then leadership can see whether a campaign is inexpensive because it uses available capacity or because labor was left out of the calculation.
Discounts also matter. A coupon can generate orders while reducing the value per order. Include company-funded discount cost or measure net revenue after discounts. If a creator code gives the customer a promotion, count the discounted order amount in the revenue measure and apply the appropriate margin assumptions. Avoid adding the discount again as a cost if your revenue number already excludes it; document the arithmetic to prevent double counting.
| Cost category | Examples | Reporting choice |
|---|---|---|
| Media | Paid placements, boosts, campaign spend | Include for paid program ROI; keep separate from organic performance |
| Production | Concepting, photography, video, editing, subtitles | Assign by campaign or document an allocation period |
| People and service | Staff time, agency management, community moderation | Show cash and fully loaded views if they answer different decisions |
| Creator and rights | Fees, usage rights, licensing, paid amplification permission | Attach cost and usage window to the specific asset or campaign |
| Promotion | Discounts, bundles, free shipping funded by brand | Use net sales or subtract once; avoid double counting |
| Measurement | Analytics work, tools, data QA | Include direct campaign setup costs or explain shared allocation |
| Post-purchase adjustments | Refunds, returns, cancellations, chargebacks | Use a mature window and state how late changes are treated |
Separate observed revenue from incremental revenue
Observed orders can be associated with social through clicks, tags, platform reporting, promo codes, or a customer’s response to a survey. Incremental orders are the additional orders that would not have occurred without the activity. The first is more accessible to reporting; the second is the causal question. A tracking label can help classify traffic, but it cannot by itself establish what would have happened in the activity’s absence.

Attribution systems distribute credit according to selected rules, windows, and data availability. Google Analytics describes attribution models and reporting paths, while platforms may use their own conversion windows and identity signals. The numbers can differ without one system being broken because they answer slightly different measurement questions. Record the platform, model, window, date range, conversion definition, and exclusions in the report.[1][2]
Consider a controlled experiment when the business needs an estimate of incremental impact and can support a sound design. A holdout or geographic test can compare exposed and unexposed groups under defined conditions, but it needs a suitable audience, enough volume, and care around contamination. Not every small store can run a statistically informative test every month. When a design is not feasible, report attributed observations and a qualitative confidence level without calling them causal lift.
Do not infer causation from a before-and-after comparison alone. Seasonality, price changes, inventory, email, search demand, promotions, and competitor activity may change at the same time. A comparison can still inform planning, but name the confounders and avoid claiming that social caused every difference.
Use UTMs as labels, not as a complete identity system
Google Analytics campaign URL documentation describes parameters such as source, medium, campaign, and content for identifying tagged traffic. A convention might use the platform as source, a stable organic or paid label as medium, and a campaign identifier as campaign. Choose consistent casing and separators, keep the values privacy-safe, and test each URL before posting. A creator link may have a distinct identifier if it helps the team compare placements.[3]
Use a link registry for campaigns with many posts. Store the clean destination, tagged version, market, owner, date, content ID, creator or placement label, and test result. This prevents several colleagues from creating slightly different campaign names for the same program. It also gives an analyst a record of what was intended when a tag appears in a report.
UTMs have limits. Links can be copied, shared privately, stripped by redirects, or opened in a browser that blocks some analytics. People may see content and later return through a search engine or direct navigation. Cross-device and consent gaps also affect visibility. Never include names, email addresses, order identifiers, or other personal information in a public query string.
For creator programs, use a unique link and, where suitable, a unique promotional code. Treat them as complementary. The link can identify tagged visits; the code can identify orders where it was entered. A code may be shared beyond the original post, and a customer may buy without using it. Neither is a complete count of the creator’s influence.
| Signal | What it tells you | What it does not prove alone |
|---|---|---|
| Reach or impressions | Platform-defined distribution or exposure | Unique people, qualified buyers, or attention quality |
| Engagement | Platform-defined interactions such as comments or saves | Store visits, purchase intent, or profitability |
| UTM sessions | Visits classified by tagged campaign values | Every social-influenced visit or incremental effect |
| Creator code orders | Orders where the promotion code was used | Only that creator caused the order or saw all resulting orders |
| Platform-attributed conversions | Conversions credited under a platform’s selected method/window | Comparable results across platforms or causality |
| Repeat purchase | Later orders from customers in a defined cohort | That social alone created loyalty or retention |
Connect platform metrics to the store’s order record
Start by reviewing the ecommerce measurement configuration. Shopify analytics and Google Analytics ecommerce reporting may show different events or totals depending on installation, consent, integration, theme, and reporting choices. Confirm which system is the source for orders, discounts, refunds, and customer status. Check that test orders are excluded where appropriate and that duplicate purchase events are not inflating a report.[4][5]
Define each stage: product view, add to cart, checkout start, purchase, cancellation, refund, and repeat order. Confirm event names and parameters with a test journey. Compare analytics data against order records using the organization’s approved process; do not export customer-level data into an unsecured social report. If identifiers or consent status prevent reconciliation, document the gap and aggregate at the level permitted by policy.
Keep platform-reported outcomes separate from store-recorded orders. A platform may report view-through conversions under its rules. Analytics may report a purchase after a tagged click. The ecommerce system may show an order that was refunded later. A finance report may recognize revenue on a different basis. Those figures can all be valid within their systems, yet they should not be added together as if they were independent sales.
Use a reconciliation table rather than force-fitting one number:
| System | Reportable item | Reconciliation question |
|---|---|---|
| Social platform | Impressions, interactions, attributed conversions | What window and attribution method did the platform apply? |
| Web analytics | Tagged sessions, events, modeled paths | Are tags consistent and events configured without duplicates? |
| Shopify or order system | Orders, discounts, refunds, customer records | Are test orders, returns, and canceled orders handled consistently? |
| Finance | Net revenue, costs, contribution, recognized period | Does the number align with the financial definition and close period? |
| CRM or survey | Lead or self-reported discovery source | Is the definition stable, voluntary, and collected appropriately? |
How to calculate a defensible ecommerce social ROI
- Choose the decision. Decide whether you are evaluating a post, creator, paid campaign, channel, or entire social program.
- Define the return measure. Use net revenue, gross profit, contribution margin, or incremental contribution and state the exact calculation.
- Set the period and market. Name dates, geography, currency, product range, and the purchase or return window.
- Inventory the costs. Include media, content, people, creator fees, rights, discounts, tools, and measurement work using a documented allocation method.
- Choose an attribution view. Record platform model, analytics model, click/view window, and any holdout or test design.
- Validate measurement. Test links, events, purchase deduplication, order totals, discounts, refunds, and repeat-customer definitions.
- Reconcile the systems. Show platform, analytics, store, and finance signals separately and explain material gaps.
- Calculate and label. Apply the agreed formula; label attributed revenue, ROAS, ROI, and incremental results distinctly.
- State uncertainty. Note missing data, sample size, attribution limits, consent gaps, and confounding changes.
- Make the next decision. Continue, adjust, test, or stop based on the evidence and the business objective.
For example, suppose an analyst has $20,000 of net revenue associated with a campaign and $8,000 of direct campaign cost. The simple attributed revenue-to-cost ratio is 2.5. That does not mean ROI is 150% unless the business has defined revenue as the return and accepted that formula. If product costs, returns, labor, and counterfactual sales are missing, the number should be labeled as an attributed revenue ratio, not incremental profit or causal ROI. The arithmetic is illustrative only, not a reported Marketboo or client result.
Account for repeat purchases without claiming social caused loyalty
Repeat purchase is valuable for many ecommerce businesses, but cohort analysis requires a clear starting event and time window. A cohort might include first-time customers whose initial order came through a defined campaign tag during a chosen period. The team can then observe later orders for that cohort. It should not conclude that social created retention simply because those customers purchased again.

Customer history may include other influences: product quality, email, paid search, service, replenishment cycles, promotions, seasonality, and prior brand awareness. A customer who uses a creator code may already know the brand. A first-time order from a UTM-tagged session may be assisted by a previous untagged video view. Report what is observable and state how the cohort was assembled.
When comparing repeat behavior, keep cohorts comparable. Differences in product category, order value, season, discount, geography, and customer mix can affect later purchasing. Use a sufficiently mature window for the product’s repurchase cycle; do not compare a newly acquired group with an older one before both have had a similar opportunity to return. If the sample is small, avoid presenting a precise lifetime value forecast as a fact.
Protect customer privacy. Use aggregated cohort reporting, apply access controls, and follow the store’s consent, retention, and data-use policies. A social measurement report rarely needs names, email addresses, street addresses, or raw order-level detail. If a more granular analysis is required, use approved internal systems and qualified review.
Read ROI alongside customer quality and operational cost
A campaign can have a favorable attributed revenue ratio and still create operational problems: high return rates, low-margin product mix, customer confusion, support volume, or creator rights costs. Add measures that reveal quality. Depending on the business, these may include net revenue after discounts, contribution margin, refund rate, first-time versus returning customers, customer service contacts, or lead qualification.
Do not build a dashboard with every available metric. Choose a compact set tied to the decision. A weekly optimization view may focus on spend, sessions, product views, add-to-carts, and order efficiency. A monthly leadership view may focus on contribution, customer mix, repeat behavior, and uncertainty. A creator review may include content cost, rights, tagged visits, code orders, and qualitative fit.
Consistency matters more than an impressive chart. Keep the definitions, attribution windows, currency conversion, return treatment, and date range stable. When a definition changes, mark the break in the trend. If a metric is estimated or modeled, say so. A transparent range is more informative than a precise percentage that implies more certainty than the data can support.
Common measurement mistakes
Calling ROAS ROI. Revenue divided by media spend leaves out cost of goods, production, people, discounts, and other costs. Name the ratio accurately.
Adding conversions from multiple dashboards. Platforms may each claim credit for the same purchase. Reconcile or report separately instead of summing.
Ignoring refunds and discounts. Gross checkout values can overstate durable revenue. Define whether the report uses ordered, net, or recognized revenue.
Assuming a code is exclusive proof. Codes leak, are shared, and may be used by existing customers. Combine signals and disclose the limitation.
Equating a tagged visit with a social-caused order. Tags help classification; causal impact requires stronger evidence or a carefully qualified observational conclusion.
Leaving out content and labor costs. The cost base should match the decision, with cash and fully loaded views separated where useful.
Using a short repeat-purchase window. Customers need time to repurchase, and categories have different cycles. Mature the cohort and state the period.
Overlooking changing conditions. Price, stock, seasonality, email, search, and promotions can affect results. Include important concurrent changes in the interpretation.
Frequently asked questions
What is a good social media ROI for ecommerce?
There is no universal benchmark that fits every margin, product category, attribution method, and cost base. Define the return and costs first, then compare results with the business’s own goals, historical performance, and a suitable test.
Is ROAS the same as ROI?
No. ROAS commonly compares attributed revenue with advertising spend, while ROI should account for a defined return and investment cost. If costs or contribution are missing, label the metric as ROAS or an attributed revenue ratio rather than ROI.
Should I count creator code sales as social revenue?
Report them as orders using that code and state the campaign period. Codes may be shared or used by customers influenced by other channels, so do not treat the count as a complete or causal estimate of creator impact.
How do I measure organic social without UTMs?
Use available platform insights, direct customer feedback collected appropriately, branded search patterns, referral reporting, and qualitative sales or support learning. Explain that missing tags reduce the ability to classify visits and avoid assigning precise causal credit.
How should repeat purchases be included?
Define a customer cohort, starting event, product scope, and observation window, then compare mature cohorts. Treat repeat orders as observed behavior, not proof that social caused retention.
Why do Meta, Google Analytics, and Shopify report different conversion totals?
They may use different identities, attribution windows, event configuration, consent signals, deduplication, and reporting definitions. Keep their figures separate until the team understands the differences and uses an agreed source for each measure.
Can I calculate ROI from attributed revenue alone?
You can calculate a revenue-to-cost ratio if the denominator is known, but it is not profit or incremental ROI unless the return definition, relevant costs, and attribution method support that interpretation.
Next step: To align social reporting with the store and landing-page journey, explore Marketboo’s Shopify and WordPress website development service.
Report a decision, not just a percentage
A useful social ROI report tells the reader what was measured, how costs were counted, which attribution view was used, what the data missed, and what the team should do next. It distinguishes platform credit from store orders and observed association from incremental impact. That framing helps leadership decide whether to scale, revise, run a stronger test, or stop spending.
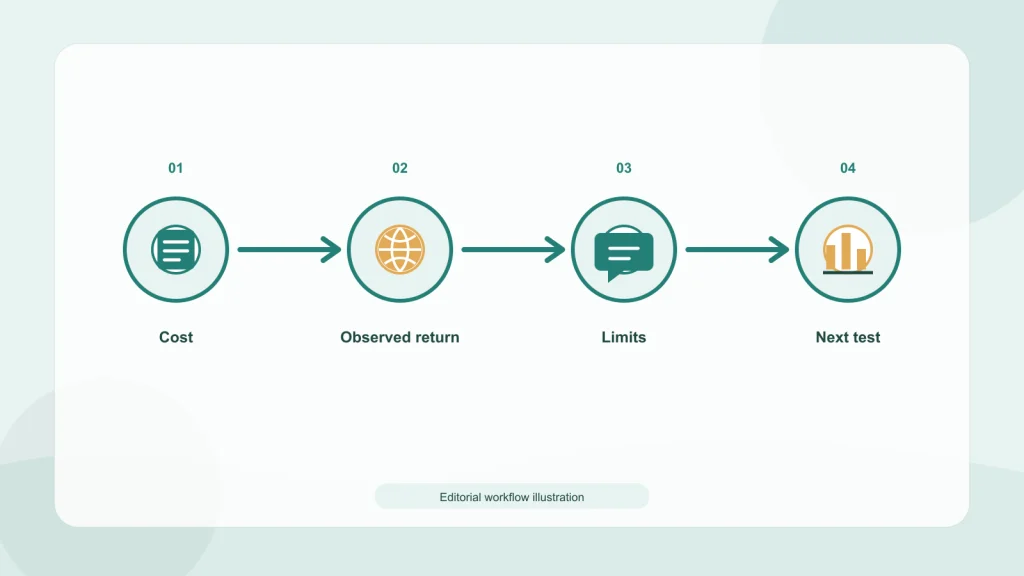
Use revenue, margin, customer quality, repeat behavior, and campaign cost in ways that match the economics of the store. Keep creator links and codes as complementary traces. Include returns and privacy limits. Where causal evidence is not available, say that plainly and share the observable signals without inflating them into proof.
To measure social media ROI for ecommerce responsibly, establish the definitions before launch and keep the same logic through reporting. A trustworthy number is not the one with the most decimal places; it is the one whose scope and limits another person can understand and reproduce.
Connect acquisition and measurement: For a broader plan across paid social and other markets, review Marketboo’s global paid media service.