
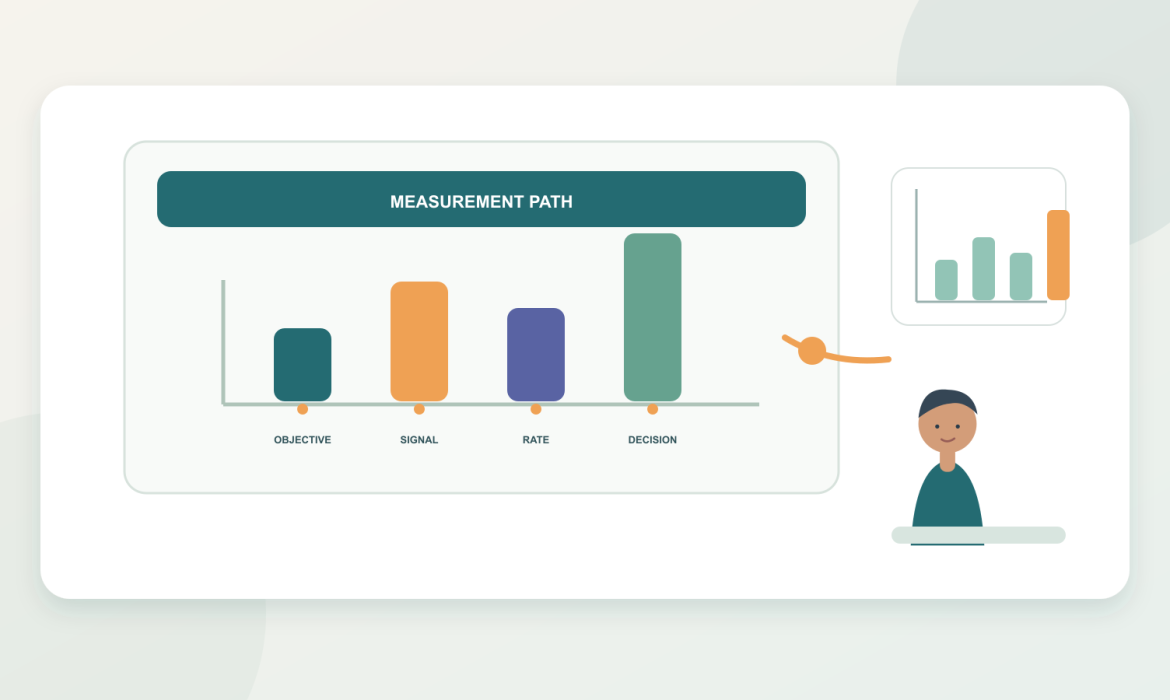
Quick answer: How to measure social media management KPIs starts with one business objective and a small set of leading and outcome indicators. Define each metric’s formula, numerator, denominator, source, time window, market, and owner. Reach and views describe distribution; engagement describes platform actions; clicks and sessions describe website behavior; qualified leads and orders describe business outcomes. Definitions differ by platform, so avoid a blended score. Report attribution limits: a model allocates credit by rules, while correlation does not prove social activity caused revenue. Choose the KPI that informs the next decision.
How to measure social media management KPIs is a question about decision-making, not about collecting every available number. A monthly report can show more followers, more views, and a healthy number of likes. Then sales asks the question that the dashboard cannot answer: “How many of these people were relevant prospects?” The problem is not that engagement metrics are useless. It is that a report often stops at the easiest numbers and never explains how they relate to the business objective.
A KPI, or key performance indicator, is a measure selected to track progress toward a defined objective. A number becomes useful when the team knows what it counts, how it is calculated, where it came from, and what decision it may inform. “Engagement rate: 4%” without a formula is not a complete metric definition; it is an ambiguous label.
How to measure social media management KPIs: build an indicator ladder
Distribution indicators include impressions, reach, video views, and watch time. They can show whether content had an opportunity to be seen under the platform’s definitions. They do not, by themselves, show that the audience included target buyers or that those people understood the message.
Engagement indicators may include comments, shares, saves, follows, or other actions. Choose actions that make sense for the objective. A technical guide may earn saves; a distributor announcement may receive fewer public reactions but produce relevant page visits. Do not assume the same action carries the same meaning on every platform.
Website indicators include link clicks, sessions, visits to a target page, and selected events. A platform click and an analytics session are not the same event. The visitor may leave before the page loads, a tracking tag may fail, or a reporting condition may differ. Keep the measures separate and investigate technical gaps before drawing conclusions.
Business outcome indicators include qualified inquiry volume, sales acceptance, orders, revenue, retention, or repeat purchase. They may be closer to business value, but they often depend on CRM definitions, sales-cycle duration, returns, currency, and other touchpoints. A form submission is not automatically a qualified lead. A platform-attributed order is not automatically incremental revenue.
Consider the objective “increase qualified distributor inquiries in a target region.” An outcome indicator might be the number of sales-accepted inquiries from that region. Leading indicators might include visits to a distributor page and downloads of a relevant specification guide. Diagnostic indicators might include link clicks, broken-link rate, and comment questions. That ladder helps the team decide whether to change content, fix the page, or review lead qualification with sales.
Define the formula beside the metric
| Objective layer | Example indicator | Definition to record | Common misread |
|---|---|---|---|
| Distribution | Reach, impressions, video views | Platform field, date range, market | Treating views as target-buyer count |
| Engagement | Selected interactions ÷ selected denominator | Actions included and whether denominator is reach, impressions, or followers | Comparing different formulas as one rate |
| Traffic | Link clicks ÷ specified impressions; sessions shown separately | Platform source and analytics source | Calling the gap “lost traffic” without testing |
| Lead quality | Verified qualified leads ÷ reviewed submissions | Region, company, need, and CRM-stage criteria | Calling every form a sales opportunity |
| Business outcome | Orders, accepted opportunities, revenue, or repeat purchase | Attribution window, refunds, currency, and revenue definition | Calling attributed value causal lift |
Engagement rate can be calculated using interactions divided by reach, impressions, followers, or video views. Those denominators answer different questions. A report that says “engagement rate rose to 3%” should state the selected actions and denominator so another person can reproduce the calculation. Click-through rate requires the same care: specify what the platform counts as a click and which impression field is used.
Website conversion rate can use sessions or users as its denominator. A rate based on sessions can differ from one based on users. If the definition changes, mark the date and show the previous and new methods; otherwise a chart may suggest a sudden improvement that is actually a formula change.
Whenever practical, show both the percentage and the numerator and denominator. “12 sales-verified inquiries from 640 target-page sessions” is more interpretable than “1.9% conversion.” Include the date range, time zone, market, filters, and deduplication method. Small samples can swing sharply; a single percentage point movement may not indicate a stable trend.
Use platform reporting to diagnose, not to replace business measurement

YouTube’s Reach reporting documentation describes impressions and how they led to watch time. This can help a team investigate whether a video received thumbnail impressions and whether viewers continued watching. It does not mean a click-through rate alone scores creative quality. Topic, traffic source, audience, and video length matter to interpretation. The checked Help page showed no visible publication or version date; a human editor should confirm the current interface and field names before publication.
Other social platforms also report reach, plays, interactions, and clicks, but labels and definitions can vary or change. When creating a report template, record the platform field as it appears, the date it was checked, and any known limits. Do not assume that a “view” means the same thing everywhere. If two platforms count video consumption differently, report them in separate rows.
Google Analytics’ URL builder documentation describes campaign parameters such as utm_source, utm_medium, and utm_campaign. The checked help page did not show a publication or version date, so recheck it before publication. Consistent tags can help identify link sources; they do not make GA4 sessions equal to platform clicks, and they do not prove that a campaign created an order.
Google Analytics also documents recommended event names, but an event name only helps when the website’s implementation records the intended action correctly. A “generate_lead” event, for example, must match the company’s chosen definition and be tested in the actual property. The checked help page showed no visible publication/version date. A data owner should verify the current naming guidance and confirm that events fire once, with the expected parameters, before a KPI report depends on them.
Choose indicators that answer management questions

| Management question | Indicators to consider | Possible action |
|---|---|---|
| Can the team deliver consistently? | On-time publishing, approval delay, rework, production hours | Adjust capacity, review timing, or content volume |
| Is the intended audience seeing content? | Reach, impressions, traffic source, audience geography | Recheck market and channel assumptions |
| Does content encourage a useful action? | Relevant interactions, tagged link clicks, resource downloads | Improve the promise and next-step path |
| Are inquiries useful to the business? | Qualified-lead rate, sales acceptance, follow-up feedback | Align lead definitions with sales |
Community work and customer education may create value that does not appear as immediate revenue. A team can track recurring question types, response time, sales reuse of an approved video, or authorized user feedback if those are defined consistently. These are process or experience indicators; do not translate them into revenue or savings without evidence.
For example, “median first response was six business hours” requires a clear start and end event, local working hours, and treatment of weekends. “Sales reused this video 18 times” requires a record that can be checked. A metric that sounds concrete can still be misleading if its collection process is inconsistent.
Separate facts, explanations, and decisions in the report

A strong report distinguishes three kinds of statements. A fact describes a measured result and its source: “The tagged social landing page recorded 640 sessions this month.” An explanation describes a possible reason: “The new product demo may have contributed, although the trade show and paid campaign also ran during this period.” A decision specifies what the team will do next: “We will test a clearer page CTA while keeping the creative unchanged.”
Separating these statements prevents a plausible hypothesis from being repeated as established cause. If branded searches rose after a campaign, note the timing and other influences: public relations, paid search, an event, a seasonal change, or existing demand may also contribute. Without an experiment or credible incrementality analysis, do not write that one social post produced the increase.
Choose one or two controlled tests per cycle. Under the same audience and destination, compare two openings; or keep the creative stable while testing the call to action. Record dates, versions, spend, market, and other campaigns. Changing the creative, budget, audience, landing page, and offer all at once makes the result difficult to interpret.
Use trends rather than isolated daily peaks. Annotate holidays, inventory issues, trade shows, account outages, platform changes, and budget shifts. If the organization serves several countries or languages, break out those dimensions. A single global total may conceal one market improving while another declines.
Build a monthly KPI report another person can reproduce
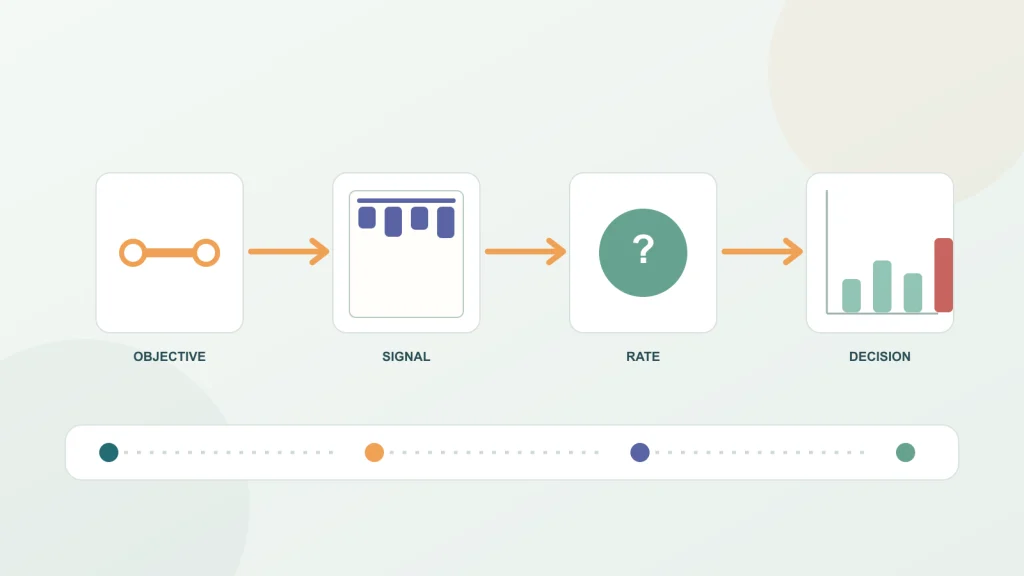
A report does not need dozens of metrics. It needs a clear path from objective to evidence. Include a compact definition for each KPI, a link to the source or dashboard, a period, market, and owner. If a field is missing, label it as missing instead of silently substituting another number.
Compare like with like. Separate paid and organic activity, platforms, regions, language versions, and creative formats where those differences affect the interpretation. If spend is included, clarify whether it includes media, production, agency hours, localization, and internal staff. A cost per inquiry without a consistent cost definition is difficult to compare.
For leadership, summarize the movement and the decision, not only the dashboard. For the working team, retain the detail needed to find a broken tag or an approval bottleneck. A useful format might include a small objective summary, a table of metric definitions, a chart annotated with campaign dates, and a short next-test section. Keep numbers close to their definitions so the reader does not need to infer what the chart means.
When presenting an outcome, show the data lineage. For example: platform report → tagged link → analytics session → CRM inquiry → sales-accepted stage. If one connection is missing, mark it. That makes it possible to distinguish reliable observation from an estimate or inferred connection.
Use workload and quality as operational KPIs
Business results are not the only way to assess the health of a social program. A team may need to know whether the content plan is manageable, whether approval is slowing every post, or whether community questions are reaching someone qualified to answer. Operational indicators can uncover these constraints before they appear as poor business outcomes.
Examples include the share of planned assets published with required reviews, the median number of business days between brief and approval, the amount of rework caused by factual corrections, the share of customer questions that receive a response within the agreed coverage window, and the fraction of links that pass a pre-publication check. Define each measure carefully. A high publish rate is not necessarily positive if content quality or factual accuracy falls.
Pair quantity measures with quality checks. For example, a team could sample published technical posts each month and verify that model names, limitations, and destination links remain correct. If the sample shows errors, the useful response is to fix the process, not to congratulate the team for publishing more posts. Operational metrics should help people improve work rather than create pressure to bypass review.
Set realistic service expectations. A small exporter may not monitor comments around the clock across every time zone. It can instead publish response hours, route urgent support requests through the correct channel, and track how often a question is escalated. A KPI that assumes unlimited coverage creates a fictional benchmark and encourages unsustainable work.
When a company compares an internal team with an agency, count the work consistently. Clarify which party performs strategy, content, localization, moderation, reporting, asset rights management, and corrections. Without a shared scope, “cost per post” can hide major differences in the service being measured. This is one reason the KPI definition belongs alongside the service agreement and the monthly report.
Set targets without pretending to know the future
A target should be anchored to a baseline, a business need, or a clearly labeled test—not copied from a generic benchmark. If no comparable baseline exists, establish one before setting a hard performance promise. The team can still set a process target, such as completing a link check for every post, while it collects outcome data.
Separate a forecast from a commitment. A planning estimate can help allocate resources, but the assumptions should be visible: target market, budget, expected volume, season, conversion definition, and data source. Avoid guarantees of follower growth, lead volume, revenue, or platform reach when those outcomes depend on factors beyond the team’s control.
Targets also need a review window. A channel might take time to build a relevant audience; a B2B inquiry may take several sales conversations before it becomes an opportunity. Compare performance against a window that reflects the decision cycle, but keep shorter technical checks for broken links or inaccurate information. A slow sales cycle is not a reason to ignore fixable errors.
When targets are missed, ask whether the target was grounded, the execution matched the plan, the audience was right, the measurement worked, and the external conditions changed. Changing the number without understanding which of those conditions moved can make the report look better while teaching the team nothing.
Choose the scorecard based on the job social is doing
A single corporate account may serve several jobs, but a monthly KPI scorecard should not try to measure all of them with one “social performance” number. If the current goal is awareness in a new market, look at relevant reach, audience geography, content completion, and branded or direct-site trends as context. If the goal is product education, look at meaningful video consumption, saves, shares, repeat questions, and visits to the technical resource. If the goal is inquiries, define the target region and company fit, then track tagged sessions, form completion, validity, and sales acceptance.
Consider two hypothetical posts. A short factory clip receives 40,000 views, mostly from outside the target region. A lower-view distributor guide receives 900 views but drives 25 sessions from the intended market and five sales-reviewed inquiries. If the objective is qualified distributor leads, the second result may be more relevant. The example illustrates how to select a KPI; it is not a Marketboo case or a benchmark. The actual outcome depends on the company’s data, qualification rules, sales cycle, and cost.
For community management, a useful scorecard may include response coverage during agreed business hours, median first response, unresolved questions, escalations, and recurring themes. Faster response is not always better if the answer is inaccurate or sent to the wrong person. Pair a response-time measure with quality checks or an escalation audit. A fast reply that promises unverified availability can harm the customer experience even if it improves the dashboard.
For customer education, sales reuse of an approved video or fewer repeated support questions can be useful indicators when the collection method is consistent. A salesperson’s statement that “the video helped” can be recorded as qualitative evidence, but it should not be converted into a revenue amount without a defensible method. Keep outcome indicators and learning signals distinct.
Check instrumentation before discussing performance
A KPI can fail because the measurement setup is incomplete. Before the campaign starts, test the tagged link from the actual post preview, verify the final redirect, confirm analytics receives a page view, and check that the intended event fires once. Use an approved test environment or a documented test procedure where the organization has one. Record the property, event name, date, and result so another person can reproduce the check.
Make sure conversion events are not double-counted by multiple tags. Confirm that a successful form submission is distinguished from a button click, and that an ecommerce purchase reflects the intended order status. If the platform and site disagree, check the time zone and date boundaries before deciding one report is wrong. Currency, order cancellation, and late CRM updates may also affect reconciliation.
Privacy controls and consent choices can affect what analytics records. Do not bypass user choices to improve attribution coverage. Follow the company’s consent configuration, contracts, and applicable rules; bring a qualified privacy or legal reviewer into the decision when needed. This article is general measurement guidance, not legal advice. In a report, disclose that some activity may not be observable because of the measurement design.
Also preserve a baseline. If the team begins measuring qualified inquiries only after a campaign, it cannot reliably compare the period with one where lead quality was never recorded. Where historical data is incomplete, say so and use the next cycle to establish a consistent baseline instead of filling in estimates as if they were observed facts.
Report examples that keep the inference honest
Clear observation: “During October, the product guide received 640 sessions with the campaign tag. Sales reviewed 12 submissions and accepted five as qualified for the target region.” This statement names the period, site measure, and business validation step. The report should still link to the dashboard and define what “qualified” means.
Qualified explanation: “The new setup video ran during the same period as a regional trade event, so the increase in tagged visits cannot be attributed to the video alone.” This sentence makes the confounding condition visible rather than hiding it in a footnote.
Useful decision: “Next month, retain the destination page and test a more specific opening in the video. We will compare target-region sessions and sales-reviewed inquiry quality, while keeping the event promotion out of the test window.” The decision identifies what changes and what will count as evidence.
Overclaim to avoid: “The video generated five new customers,” when the available records show only five form submissions or when the customer’s journey included other channels. Attribution, qualification, and purchase are different stages. Use the strongest claim that the evidence supports and stop there.
A report can be concise and still transparent. Keep the detailed definition and source close to the summary, not hidden in a distant methodology page. If a metric has changed from prior months, identify the change in the chart and explain its effect on comparability.
How to create a reviewable social KPI system
- Write the business objective as an observable outcome and identify the decision owner.
- Build a small indicator ladder for distribution, interaction, website behavior, and business outcomes.
- For each KPI, record its formula, numerator, denominator, source, date range, time zone, and deduplication rule.
- Map platform fields to analytics and CRM fields, marking definitions that differ or data that is missing.
- Break out relevant markets, languages, platforms, paid/organic activity, and creative versions.
- Show actual counts with rates, annotate exceptions, and label facts separately from explanations.
- Choose one or two next actions, state what evidence will test them, and set the next review date.
Common KPI traps and how to avoid them
Vanity metrics without a job. Followers may describe account size, but they do not prove that the audience matches the buyer. Keep the number if it helps describe a community; do not make it the sole measure of lead generation or product education.
Changing formulas without a note. If the team changes the engagement denominator, annotate the break in the series. A consistent, modest metric is more useful than a dramatic rate created by changing its calculation.
Adding unlike numbers together. Reach on two platforms may include overlapping people and different definitions. Summed totals can overstate unique exposure. Report the platform values separately unless there is a defensible deduplication method.
Reporting platform conversions as revenue. A platform may attribute an action under its own window and model. That can be useful for in-platform optimization, but it is not necessarily the company’s verified order total or incremental lift. Show platform attribution and business-system outcomes separately.
Ignoring sample size and cycle length. A few leads in one week cannot necessarily settle a long-cycle B2B question. State the sample and window. Review a period that gives the sales process time to progress, but preserve regular technical checks so broken links are not left unnoticed.
FAQ
What is the most important social media KPI?
It depends on the objective. Brand discovery, site traffic, qualified inquiries, and customer education require different indicators. Choose the KPI after stating the decision it should inform.
Should we still track follower growth?
It can describe account or community growth, but it does not independently show target-audience quality, reach, website behavior, or revenue.
Should engagement rate use reach or followers as the denominator?
Use the denominator that answers the question and write it beside the formula. A reach-based rate and a follower-based rate are different measures and should not be compared without explanation.
Should platform clicks equal GA4 sessions?
No. They are different measures with different collection conditions. Check redirects, tags, privacy settings, and date windows, then report each number under its source.
Can branded search prove social media impact?
Not by itself. Note other campaigns and market conditions. Without an experiment or credible incrementality analysis, a timing relationship should not be written as a causal claim.
Does a small team need complex attribution?
First make campaign tags, key website events, and lead-quality definitions reliable. Consider a more complex model only when the data and business decision justify the extra work.
Should a report be weekly or monthly?
Technical issues and publishing operations can be checked weekly. Business outcomes should use a monthly or longer window that fits the company’s sales cycle.
Conclusion: start with the decision the KPI should support
How to measure social media management KPIs is ultimately a question about connecting a goal, a definition, and a next action. A reliable report shows more than attractive numbers: it explains how each figure was counted, where the data ends, and what the team can reasonably infer. Before the next monthly review, pick one metric and check whether another person could reproduce it from the stated source, numerator, denominator, market, and time window. If not, clarify the measure before debating whether it rose or fell.
If you need to define how content publishing, community response, and reporting fit together, review Marketboo’s social media management services and bring the KPI definitions you want the work to support.
If the measurement plan also needs to cover organic search and AI visibility, explore Marketboo’s SEO/GEO services. Define social, search, and website indicators separately before aligning them to a shared business objective.